

Effect of low-temperature phase change on the re-equilibration of brine inclusions hosted in quartz minerals
-
摘要: 流体包裹体显微测温分析应当遵循先开展均一温度测定、后进行冰点测定的分析流程,但在实际操作过程中该测试流程并未严格执行,不少研究者在测完冰点温度(Tm)后继续重复测试该样品的均一温度(Th),从而导致测试结果可能存在诸多不确定性。为了揭示低温相变过程对盐水包裹体再平衡作用的影响,引起广大研究人员对流体包裹体显微测温流程的重视,在盐水包裹体岩相学观察以及显微激光拉曼分析的基础上,开展流体包裹体显微测温分析,结合流体包裹体PVTx数值模拟以及前人研究结果,定量对比不同测温顺序得到的显微测温数据的差异。结果表明:冰点测试之前,盐水包裹体均一温度可以被多次重复测试;在低温相变测温过程中盐水包裹体可能会发生拉伸甚至泄露,其均一温度值会有一定程度的上升,但其冰点温度值基本不变,因此低温相变测温可能会造成其记录的原始信息发生重置;相较于方解石矿物,石英内部的盐水包裹体具有更强的抵抗再平衡作用影响的能力;较高的气体充填度以及高盐度可以在一定程度上减缓再平衡作用对盐水包裹体的影响;在低温相变测温过程中,由于水结冰产生的体积膨胀作用,盐水包裹体发生拉伸甚至泄露等再平衡现象普遍存在,导致盐水包裹体的均一温度值普遍升高。Abstract: Microthermometric measurement of fluid inclusions should follow the sequence of measuring homogenization temperature (Th) first, followed by the measurement of final freezing point temperature (Tm). However, in practice, this measurement sequence has not always been strictly followed. Many researchers may repeatedly measure the homogenization temperature of fluid inclusions even after the measurement of the final freezing point temperature. This may result in erroneous microthermometric data being obtained. In order to highlight this issue and to emphasize the importance of following the correct microthermometric measurement sequence, this study carried out repeated microthermometric measurements of brine inclusions and quantitatively compared the differences in the microthermomitric data obtained from different microthermomitric measurement sequences. The measurement exercise was aided by petrographic observation of brine inclusions and microscopic laser Raman analysis and fluid inclusion PVTx modelling. The results indicate that prior to the measurement of the final freezing point temperature, the homogenization temperature of brine inclusions can be repeatedly measured with the Th data showing no obvious deviation. During the measurement of the final freezing point temperature, the brine inclusion may undergo stretching or even leakage, and any subsequent Th measurements may yield elevated values, but Tm value remains largely unchanged. Therefore, low-temperature (freezing) phase-change measurement may cause resetting of the original PVTx information recorded. Compared to calcite minerals, brine inclusions hosted in quartz have stronger resistance to the influence of re-equilibration, and higher vapor filling degree and high salinity can offset the influence of brine inclusion re-equilibration to a certain extent. In the process of low-temperature phase change temperature measurement, due to the inflation caused by water freezing, it is common for brine inclusions to undergo stretching or even leakage, leading to a general increase in the homogenization temperature of brine inclusions.
-
Key words:
- brine inclusion /
- microthermometric analysis /
- re-equilibration /
- PVTx modeling /
- vapor filling degree /
- salinity
-

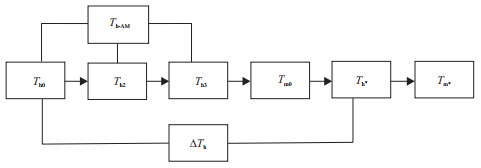
图 1 流体包裹体显微测温流程
Figure 1. Measurement sequence for fluid inclusion microthermometric analysis

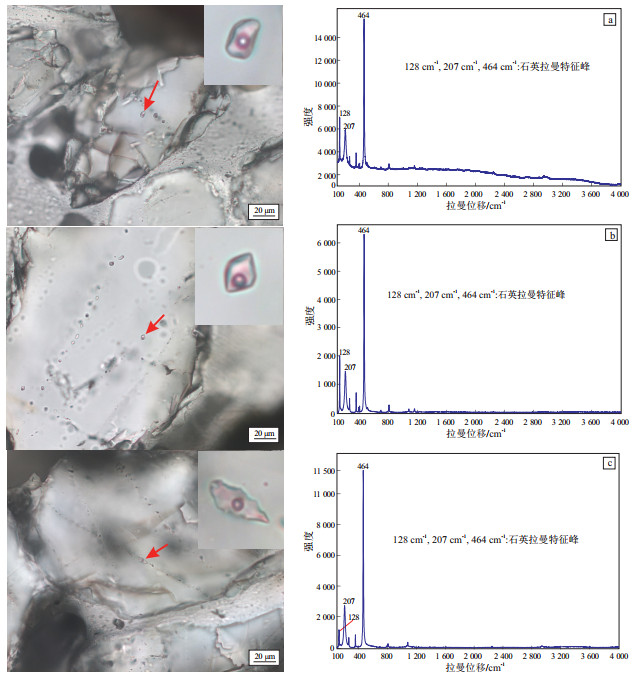
图 2 石英矿物中盐水包裹体显微照片及其显微激光拉曼光谱
Figure 2. Microphotographs and Raman spectra of brine inclusions within quartz minerals

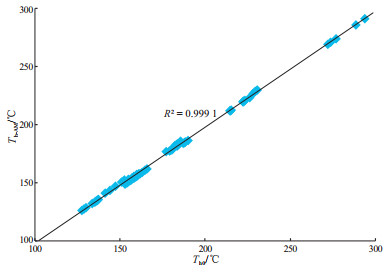
图 3 流体包裹体显微测温实验Th0与Th-AM交会图
Figure 3. Cross plots of Th0 and Th-AM values of fluid inclusion microthermometric measurement

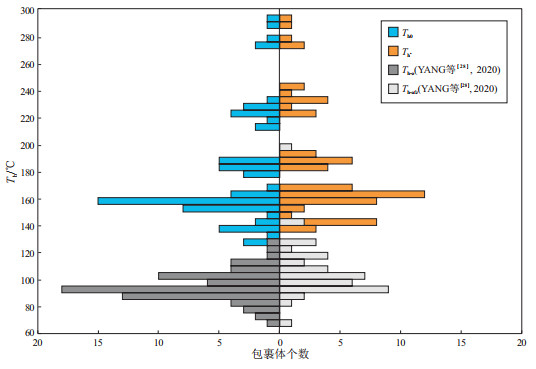
图 4 低温相变测温前后盐水包裹体均一温度变化
Figure 4. Barcharts of Th values before and after low-temperature phase-change measurement, respectively

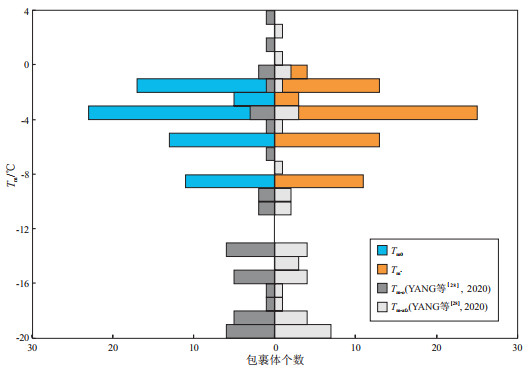
图 5 低温相变测温前后盐水包裹体冰点温度变化
Figure 5. Barcharts of Tm values before and after low-temperature phase-change measurement, respectively

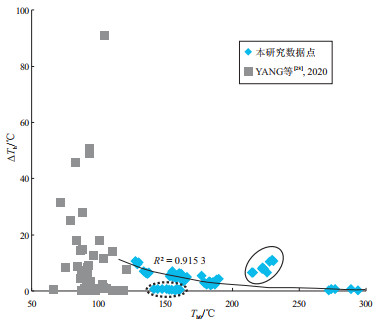
图 6 流体包裹体显微测温实验Th0与ΔTh交会图
Figure 6. Cross plots of Th0 and ΔTh values of fluid inclusion microthermometric measurement

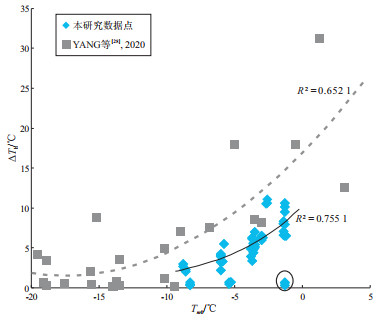
图 7 流体包裹体显微测温实验Tm0与ΔTh交会图
Figure 7. Cross plots of Tm0 and ΔTh values of fluid inclusion microthermometric measurement

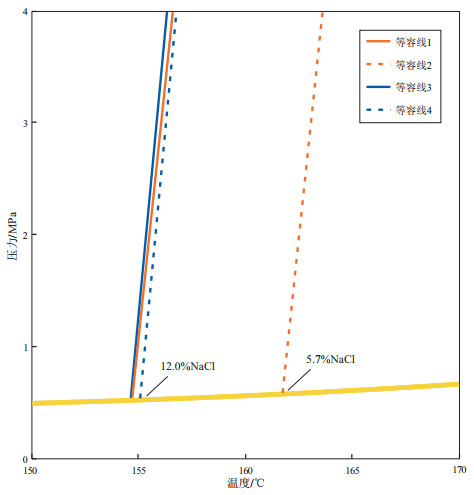
图 8 两种不同组分盐水包裹体的P-T相图
Figure 8. P-T projection of two brine inclusions having different salinity values
表 1 流体包裹体显微测温实验数据
Table 1. Summary of fluid inclusion microthermometric measurement results
井名 深度/m FIA Th0/℃ Th2/℃ Th3/℃ Th-AM/℃ Tm0/℃ Th*/℃ ΔTh/℃ Tm*/℃ Y33-1 3 771.0 Ⅰ 152.8 152.3 152.6 152.6 -3.5 158.0 5.2 -3.5 153.6 153.3 153.8 153.6 -3.5 159.0 5.4 -3.5 153.8 154.2 154.0 154.0 -3.5 159.8 6.0 -3.5 154.2 154.2 154.5 154.3 -3.5 160.2 6.0 -3.5 154.7 154.5 154.8 154.7 -3.5 161.7 7.0 -3.5 155.5 155.2 155.4 155.4 -3.5 160.5 5.0 -3.5 156.2 156.1 156.3 156.2 -3.5 161.6 5.4 -3.5 157.3 157.3 157.3 157.3 -3.6 162.1 4.8 -3.6 157.8 162.6 163.5 161.3 -3.6 162.2 4.4 -3.6 157.8 158.0 157.8 157.9 -3.6 162.9 5.1 -3.6 158.4 158.4 158.6 158.5 -3.6 163.6 5.2 -3.6 158.5 158.8 158.5 158.6 -3.6 163.8 5.3 -3.6 158.8 159.0 159.0 158.9 -3.6 164.4 5.6 -3.6 159.1 158.9 159.4 159.1 -3.6 164.7 5.6 -3.6 159.4 159.6 159.5 159.5 -3.6 165.5 6.1 -3.6 159.9 159.7 159.9 159.8 -3.7 166.2 6.3 -3.7 161.7 161.8 162.0 161.8 -3.7 167.8 6.1 -3.7 162.9 162.8 163.2 163.0 -3.7 166.3 3.4 -3.7 164.5 164.5 164.7 164.6 -3.8 168.4 3.9 -3.8 165.6 165.5 165.8 165.6 -3.8 170.5 4.9 -3.8 4 347.0 Ⅰ 176.8 176.6 176.8 176.7 -5.8 182.3 5.5 -5.8 182.2 182.0 182.0 182.1 -5.9 185.5 3.3 -5.9 183.5 183.6 183.5 183.5 -6.0 186.7 3.2 -5.9 185.5 185.3 185.6 185.5 -6.0 188.7 3.2 -6.0 186.8 187.0 187.1 187.0 -6.0 189.0 2.2 -6.0 187.8 187.8 187.8 187.8 -6.0 191.7 3.9 -6.0 188.1 188.3 188.0 188.1 -6.0 192.2 4.1 -6.0 189.6 189.5 189.8 189.6 -6.0 193.8 4.2 -6.0 Y36-2 3 771.0 Ⅰ+ 141.1 141.1 141.2 141.1 -5.3 141.8 0.7 -5.3 143.8 143.6 143.9 143.8 -5.3 144.5 0.7 -5.3 147.3 147.2 147.5 147.3 -5.3 148.0 0.7 -5.4 150.8 150.9 150.8 150.8 -5.4 151.5 0.7 -5.4 152.3 152.3 152.4 152.3 -5.4 152.8 0.5 -5.4 Ⅱ# 271.8 271.5 272.0 271.8 -1.3 272.1 0.3 -1.3 273.6 273.9 273.9 273.8 -1.3 274.2 0.6 -1.3 276.7 282.2 280.9 279.9 -1.3 277.3 0.6 -1.3 288.5 288.5 288.9 288.6 -1.3 289.2 0.7 -1.3 293.7 293.2 294.3 293.7 -1.3 294.0 0.3 -1.3 4 051.0 Ⅰ+ 154.6 154.5 154.8 154.6 -8.3 155.1 0.5 -8.3 156.6 156.5 156.8 156.6 -8.3 156.9 0.3 -8.3 157.8 157.8 157.8 157.8 -8.3 158.2 0.4 -8.3 158.0 158.0 158.2 158.1 -8.3 158.7 0.7 -8.3 159.5 159.3 159.4 159.4 -8.3 159.9 0.4 -8.3 160.6 160.7 160.9 160.7 -8.3 161.0 0.4 -8.3 H34-6 3 833.0 Ⅰ 127.2 127.0 127.3 127.2 -1.3 137.8 10.6 -0.7 128.7 128.8 128.9 128.8 -1.3 138.2 9.5 -0.7 129.8 129.6 129.9 129.8 -1.3 139.9 10.1 -0.8 133.5 139.0 139.9 137.5 -1.4 140.6 7.1 -0.8 3 903.0 Ⅰ 135.2 135.0 135.3 135.2 -2.9 141.5 6.3 -3.2 135.5 135.4 135.7 135.5 -3.0 141.8 6.3 -3.3 136.3 136.1 136.2 136.2 -3.0 142.3 6.0 -3.3 136.6 136.5 136.8 136.6 -3.0 142.9 6.3 -3.3 137.1 137.0 137.3 137.1 -3.0 143.6 6.5 -3.3 Y29-1 3 196.0 Ⅰ 178.8 178.9 180.0 179.2 -8.8 181.8 3.0 -8.8 179.6 179.6 179.6 179.6 -8.8 182.3 2.7 -8.8 180.5 180.3 180.6 180.5 -8.7 182.8 2.3 -8.7 183.2 182.9 183.1 183.1 -8.6 185.2 2.0 -8.6 184.3 184.0 184.6 184.3 -8.6 186.6 2.3 -8.6 Y15-1 3 104.5 Ⅰ* 227.8 227.4 227.8 227.7 -2.7 238.3 10.5 -2.7 229.3 229.7 229.4 229.5 -2.6 240.4 11.1 -2.7 230.5 238.3 238.8 235.9 -2.6 241.1 10.6 -2.6 Y27-2 3 551.5 Ⅰ* 214.3 213.8 214.5 214.2 -1.2 220.8 6.5 -1.2 214.6 215.0 215.2 214.9 -1.3 221.1 6.5 -1.3 215.1 217.8 218.3 217.1 -1.3 221.7 6.6 -1.3 3 807.5 Ⅰ* 221.9 221.6 221.9 221.8 -1.3 229.8 7.9 -1.2 222.2 222.5 222.7 222.5 -1.4 230.5 8.3 -1.3 222.5 222.1 222.8 222.5 -1.4 230.5 8.0 -1.3 223.2 222.9 223.3 223.1 -1.4 231.2 8.0 -1.3 225.8 225.5 226.0 225.8 -1.4 232.4 6.6 -1.3 注:+代表图 6虚线圈中数据,*代表图 6实线圈中数据,#代表图 7实线圈中数据。  下载: 导出CSV
-
[1] ROEDDER E. Fluid inclusions[M]//RIBBE P H. Reviews in mineralogy. Washington: Mineralogical Society of America, 1984. [2] GOLDSTEIN R H, REYNOLDS T J. Systematics of fluid inclusions in diagenetic minerals[M]. Tulsa: SEPM, 1994. [3] 卢焕章, 范宏瑞, 倪培, 等. 流体包裹体[M]. 北京: 科学出版社, 2004.LU Huanzhang, FAN Hongrui, NI Pei, et al. Fluid inclusions[M]. Beijing: Science Press, 2004. [4] APLIN A C, MACLEOD G, LARTER S R, et al. Combined use of confocal laser scanning microscopyand PVT simulation for estimating the composition and physical properties of petroleum in fluid inclusions[J]. Marine and Petroleum Geology, 1999, 16(2): 97-110. doi: 10.1016/S0264-8172(98)00079-8 [5] PIRONON J, CANALS M, DUBESSY J, et al. Volumetric reconstruction of individual oil inclusions by confocal scanning laser microscopy[J]. European Journal of Mineralogy, 1998, 10(6): 1143-1150. doi: 10.1127/ejm/10/6/1143 [6] DUBESSY J, AUDEOUD D, WILKINS R, et al. The use of the Raman microprobe MOLE in the determination of the electrolytes dissolved in the aqueous phase of fluid inclusions[J]. Chemical Geology, 1982, 37(1/2): 137-150. [7] DUBESSY J, MOISSETTE A, BÄKKER R J, et al. High-temperature Raman spectroscopic study of H2O-CO2-CH4 mixtures in synthetic fluid inclusions: first insights on molecular interactions and analytical implications[J]. European Journal of Mineralogy, 1999, 11(1): 23-32. doi: 10.1127/ejm/11/1/0023 [8] PIRONON J, BARRES O. Semi-quantitative FT-IR microanalysis limits: evidence from synthetic hydrocarbon fluid inclusions in sylvite[J]. Geochimica et Cosmochimica Acta, 1990, 54(3): 509-518. doi: 10.1016/0016-7037(90)90348-O [9] PIRONON J, THIÉRY R, AYT OUGOUGDAL M, et al. FT-IR measurements of petroleum fluid inclusions: methane, n-alkanes and carbon dioxide quantitative analysis[J]. Geofluids, 2001, 1(1): 2-10. doi: 10.1046/j.1468-8123.2001.11002.x [10] STASIUK L D, SNOWDON L R. Fluorescence micro-spectrometry of synthetic and natural hydrocarbon fluid inclusions: crude oil che-mistry, density and application to petroleum migration[J]. Applied Geochemistry, 1997, 12(3): 229-241. doi: 10.1016/S0883-2927(96)00047-9 [11] RYDER A G. Quantitative analysis of crude oils by fluorescence lifetime and steady state measurements using 380 nm excitation[J]. Applied Spectroscopy, 2002, 56(1): 107-116. doi: 10.1366/0003702021954287 [12] GUILLAUME D, TEINTURIER S, DUBESSY J, et al. Calibration of methane analysis by Raman spectroscopy in H2O-NaCl-CH4 fluid inclusions[J]. Chemical Geology, 2003, 194(1/3): 41-49. [13] APLIN A C, LARTER S R, BIGGE M A, et al. Confocal microscopy of fluid inclusions reveals fluid-pressure histories of sediments and an unexpected origin of gas condensate[J]. Geology, 2000, 28(11): 1047-1050. doi: 10.1130/0091-7613(2000)28<1047:CMOFIR>2.0.CO;2 [14] APLIN A C, LARTER S R, BIGGE M A, et al. PVTX history of the North Sea's Judy oilfield[J]. Journal of Geochemical Exploration, 2000, 69-70: 641-644. doi: 10.1016/S0375-6742(00)00066-2 [15] THIÉRY R, PIRONON J, WALGENWITZ F, et al. PIT (Petroleum Inclusion Thermodynamic): a new modeling tool for the characterization of hydrocarbon fluid inclusions from volumetric and microthermometric measurements[J]. Journal of Geoche-mical Exploration, 2000, 69-70: 701-704. doi: 10.1016/S0375-6742(00)00085-6 [16] EADINGTON P J, LISK M, KRIEGER F W. Identifying oil well sites: US, 5543616[P]. 1996-08-06. [17] LISK M, O'BRIEN G W, EADINGTON P J. Quantitative evaluation of the oil-leg potential in the Oliver gas field, Timor Sea, Australia[J]. AAPG Bulletin, 2002, 86(9): 1531-1542. [18] LIU Keyu, EADINGTON P. Quantitative fluorescence techniques for detecting residual oils and reconstructing hydrocarbon charge history[J]. Organic Geochemistry, 2005, 36(7): 1023-1036. doi: 10.1016/j.orggeochem.2005.02.008 [19] LIU Keyu, EADINGTON P, MIDDLETON H, et al. Applying quantitative fluorescence techniques to investigate petroleum charge history of sedimentary basins in Australia and Papuan New Guinea[J]. Journal of Petroleum Science and Engineering, 2007, 57(1/2): 139-151. [20] LIU Keyu, GEORGE S C, LU Xuesong, et al. Innovative fluorescence spectroscopic techniques for rapidly characterising oil inclusions[J]. Organic Geochemistry, 2014, 72: 34-45. doi: 10.1016/j.orggeochem.2014.04.010 [21] GEORGE S C, KRIEGER F W, EADINGTON P J, et al. Geoche-mical comparison of oil-bearing fluid inclusions and produced oil from the Toro sandstone, Papua New Guinea[J]. Organic Geochemistry, 1997, 26(3/4): 155-173. [22] GEORGE S C, VOLK H, AHMED M. Oil-bearing fluid inclusions: geochemical analysis and geological applications[J]. Acta Petrologica Sinica, 2004, 20(6): 1319-1332. doi: 10.3321/j.issn:1000-0569.2004.06.002 [23] GEORGE S C, VOLK H, AHMED M. Geochemical analysis techniques and geological applications of oil-bearing fluid inclusions, with some Australian case studies[J]. Journal of Petroleum Science and Engineering, 2007, 57(1/2): 119-138. [24] WATERMAN D, HORSFIELD B, HALL K, et al. Application of micro-scale sealed vessel thermal desorption-gas chromatography-mass spectrometry for the organic analysis of airborne particulate matter: linearity, reproducibility and quantification[J]. Journal of Chromatography A, 2001, 912(1): 143-150. doi: 10.1016/S0021-9673(01)00525-8 [25] VOLK H, FUENTES D, FUERBACH A, et al. First on-line ana-lysis of petroleum from single inclusion using ultrafast laser ablation[J]. Organic Geochemistry, 2010, 41(2): 74-77. doi: 10.1016/j.orggeochem.2009.05.006 [26] 张鼐. 含油气盆地流体包裹体分析技术及应用[M]. 北京: 石油工业出版社, 2016.ZHANG Nai. Fluid inclusion analysis techniques and applications in oil and gas-bearing basins[M]. Beijing: Petroleum Industry Press, 2016. [27] THIÉRY R, PIRONON J, WALGENWITZ F, et al. Individual characterization of petroleum fluid inclusions (composition and P-T trapping conditions) by microthermometry and confocal laser scanning microscopy: inferences from applied thermodynamics of oils[J]. Marine and Petroleum Geology, 2002, 19(7): 847-859. doi: 10.1016/S0264-8172(02)00110-1 [28] YANG Peng, LIU Keyu. Fluid inclusion re-equilibration in carbonate rock caused by freezing during microthermometric analysis[J]. Acta Geologica Sinica, 2020, 94(1): 580-582. [29] BODNAR R J. Revised equation and table for determining the freezing point depression of H2O-NaCl solutions[J]. Geochimica et Cosmochimica Acta, 1993, 57(3): 683-684. doi: 10.1016/0016-7037(93)90378-A [30] BAKKER R J. Package FLUIDS 1. Computer programs for analysis of fluid inclusion data and for modelling bulk fluid properties[J]. Chemical Geology, 2003, 194(1/3): 3-23. [31] BODNAR R J, VITYK M O. Interpretation of microterhrmometric data for H2O-NaCl fluid inclusions[C]//Fluid inclusions in minerals: methods and applications. Pontignano: Siena, 1994. -

计量
- 文章访问数: 816
- HTML全文浏览量: 233
- PDF下载量: 52
- 被引次数: 0
 苏公网安备32021102000780号